“Unemployment is like a headache or a high temperature — unpleasant and exhausting but not carrying in itself any explanation of its cause,” British economist William Beveridge famously quipped.
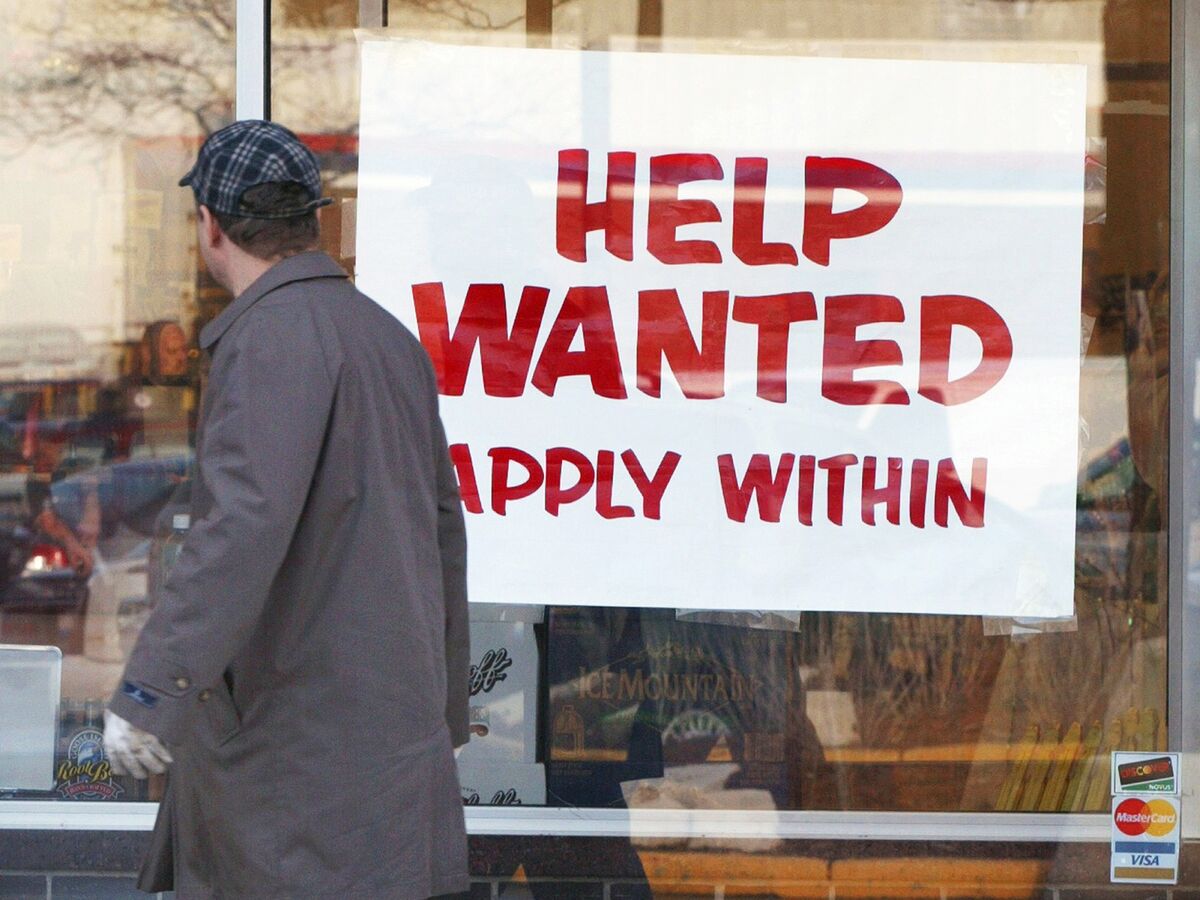
Today the U.S. labor market is once again beset by a puzzle that’s exemplified in Beveridge’s curvaceous economic namesake: the unemployment rate remains relatively high despite complaints by businesses that they can’t seem to fill jobs.
The curious state of affairs is demonstrated in the Beveridge Curve, which charts the relationship between the unemployment rate and the job opening rate. As the availability of jobs increases (shown on the y-axis) the unemployment rate (on the x-axis) tends to fall). In a typical business cycle, the Beveridge curve would be expected to complete a counterclockwise loop, with the unemployment rate initially soaring and the rate of open jobs staying very small, then gradually moving to the left as the economy healed.
But the “Covid-19 pandemic has caused the Beveridge curve to shift in an unprecedented way,” writes Thomas Lubik, an economist at the Richmond Fed. The unemployment rate spiked in early 2020 as usual, but job-opening rates have since increased much faster, translating into “a Beveridge curve that is much steeper than the pre-Covid curve.”
You can see the dynamic in the below chart from Lubik, which shows the post-pandemic curve as a thin dotted line and compares it to the bolder pre-pandemic curve based on labor data from 2000 onwards. The post-Covid Beveridge Curve has almost morphed into an up-and-down line, meaning unemployment barely budges even as job openings go higher and higher.
What could cause such a dramatic change? Lubik suggests a mismatch between workers and would-be employers, meaning employers may be struggling to find the right employees to fill open jobs. “Employers need to post more vacancies to fill a given number of positions. In terms of the model, an outward shift of the Beveridge curve can therefore be explained by a decline in match efficiency,” he says.
Of course, attitudes towards the work being advertised may also have shifted and there are plenty of anecdotes about people who are reluctant to work in the current environment. Either way, the sharp shift in the Beveridge Curve suggests post-pandemic job creation has somehow become much more difficult than before.
“A reduction of the unemployment rate to pre-Covid levels would require job openings to be at twice the level they were before,” Lubik concludes.
"much" - Google News
October 25, 2021 at 03:08PM
https://ift.tt/3GgSslL
One Chart Shows Just How Much Covid Has Changed the Labor Market - Bloomberg
"much" - Google News
https://ift.tt/37eLLij
Shoes Man Tutorial
Pos News Update
Meme Update
Korean Entertainment News
Japan News Update
Bagikan Berita Ini


0 Response to "One Chart Shows Just How Much Covid Has Changed the Labor Market - Bloomberg"
Post a Comment